New tools for exploring the surface of Mars: the Planetary SUrface Portal (PSUP) and the iMars webGIS
7 September 2017
In past decades, spacecraft have sent back huge amounts of complex data about Mars, providing a wealth of information about the planet. More than ever, the scientific community needs a way to sift through, compare, and analyse these data, prompting the development of two new tools for exploring the surface of the Red Planet: the iMars webGIS and the Planetary SUrface Portal (PSUP).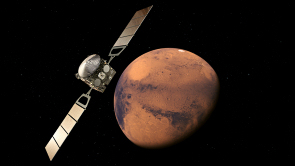 |
| Artist's impression of Mars Express. Credit: ESA/ATG medialab |
Among the many different targets for investigation in our Solar System, Mars is a special case due to the sheer volume of data we have collected from the numerous spacecraft that have flown past, orbited, landed on, or traversed the surface of the Red Planet.
Two new tools have now been developed to allow scientists to access processed data from missions including ESA's Mars Express mission and from the ESA Planetary Science Archive. Users can browse data (high-level and raw), view image footprints, combine and compare datasets from different orbits, missions, and spacecraft instruments, hunt for signs of how the Martian surface has changed over time, and more.
The Planetary SUrface Portal (PSUP): Visualising the Martian surface
PSUP was developed by experts at the observatories of Paris Sud (OSUPS) and Lyon (OSUL), and is an important legacy of ESA's Mars Express mission. The web portal allows scientists to browse, process, download, distribute, merge, and visualise high-level data mainly related to the Martian surface from Mars Express, and NASA's Mars Reconnaissance Orbiter and 2001 Mars Odyssey missions.
"PSUP is unique due to the quality of the high-level hyperspectral data available, all of which are processed and validated," says François Poulet, science manager of PSUP and an astronomer at Institut d'Astrophysique Spatiale, CNRS/Université Paris-Sud, France. "It's a way to combine and display data of Mars, on both a global and local scale, in one place."
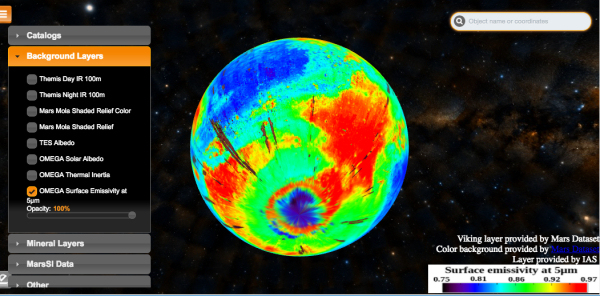 |
| Using PSUP: Viewing OMEGA data of Mars' surface emissivity. Credit: OSUPS/OSUL/CNES/ESA |
PSUP contains two key modules: MarsSI (Mars System Information), which lets users access, process, and download surface data–including a unique tool to create local digital terrain models on demand–and Mars Visu, which allows users to visualise various datasets in 3D–including global mineralogical maps, geomorphologic maps, and various other catalogues.
"The digital models of Mars' surface available on PSUP are created via state-of-the-art data reduction methods, and the portal contains impressive global mineral maps and calibrated data from OMEGA that'll be updated as the results of new observations and analyses arrive," adds Poulet. OMEGA is the Near-Infrared Mineralogical Mapping Spectrometer aboard Mars Express; the instrument has been mapping the Martian surface since it arrived at Mars in late 2003. "I'm very proud that PSUP can provide such high-quality processed products and data analysis from more than a decade of observations to both the science community and public," says Poulet.
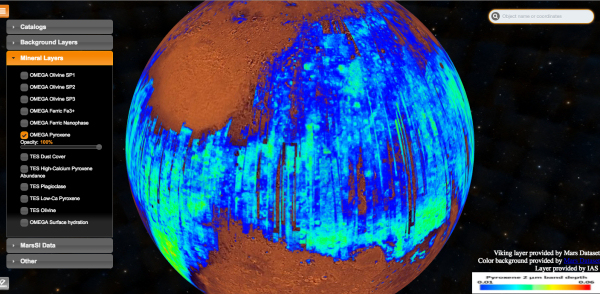 |
| Using PSUP: Viewing OMEGA mineralogical data of Mars' pyroxene content. Credit: OSUPS/OSUL/CNES/ESA |
Poulet has been closely involved in analysing regions of Mars as part of a project to identify potential landing sites for the ExoMars 2020 mission, as has the science manager for MarsSI, Cathy Quantin-Nataf.
"As an example of an important application of these tools, without the PSUP, and MarsSI in particular, it wouldn't have been possible to propose what was then an unknown location (Oxia Planum) as the landing site for ExoMars 2020," says Quantin-Nataf, a professor at University of Lyon, France. "Assessing Oxia Planum required us to process tons of data that hadn't yet been explored–this would have taken an unreasonable amount of time without MarsSI."
The iMars web-based geographic information system: Identifying signs of a changing surface
The iMars web-based geographic information system, or iMars webGIS, brings together space-based imaging and high-precision 3D data of Mars from Mars Express' High Resolution Stereo Camera (HRSC), which can be displayed alongside a vast quantity of additional datasets and images from other Mars missions.
The HRSC data are automatically adjusted to each other ('bundle-block adjusted'), mapped onto the same coordinate system ('co-registered' and 'orthorectified') using highly precise digital terrain models (derived from stereo matching and tied to global control terrain data from the Mars Orbiter Laser Altimeter (MOLA) on NASA's Mars Global Surveyor ('terrain-corrected')).
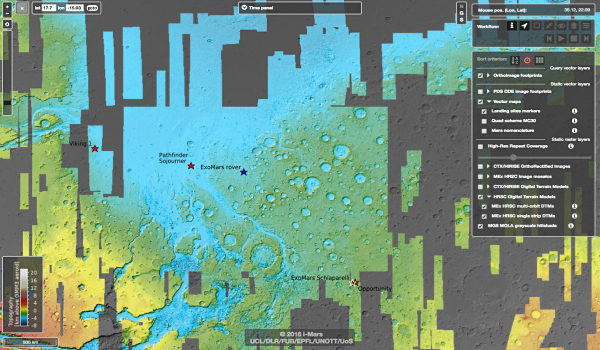 |
| Using iMars: Viewing Mars Express data of the MC11 quadrangle. Credit: ESA/iMars (UCL/FUB/EPFL/UNOTT/UoS) |
The iMars webGIS displays HRSC high-level data products (digital terrain models and orthoimages) covering approximately half of the Martian surface–this can be used as 'base data' against which to explore and compare other observations of Mars.
Additional data from the Mars Reconnaissance Orbiter's Context Camera (CTX) are available over around 20% of the same area; where these datasets overlap, the two can be co-registered and again used as base data for further high-resolution datasets and models (such as those from Mars Global Surveyor's Mars Orbiter Camera (MOC) and High Resolution Imaging Science Experiment (HiRISE)).
"iMars is an expert tool for detecting and visualising changes on Mars' surface over time," explains Sebastian Walter of Freie Universitaet Berlin, Germany, who led the management and development of iMars' webGIS element. "To detect changes such as landslides, new impact craters, and the evolution of the polar caps and frosts, we need to precisely combine several images of the same spot on the ground taken at different times–and that's incredibly difficult to do."
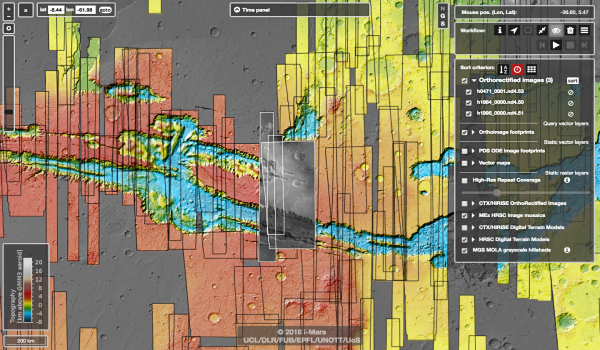 |
| Using iMars: Viewing Mars Express data of Valles Marineris. Credit: ESA/iMars (UCL/FUB/EPFL/UNOTT/UoS) |
Thousands of images exist from past ESA and NASA campaigns at Mars. Combining and aligning these can be problematic because the exact positioning ('pointing') of the camera at the moment that an image is taken differs between orbits, cameras, and missions.
"If you stacked two images of the same feature atop one another, that feature would most probably not line up in the same spot," adds Walter. "iMars solves this problem by automatically co-registering many of the available images to a common baseline, and the webGIS allows us to view and visualise all the data in one place. This co-registering is key to iMars' value; it allows scientists to accurately and comprehensively compare data across missions, as it's all displayed in the same reference system."
The iMars webGIS provides a way to comprehensively view and explore the Martian surface across both space and time. Rather than merging images taken across different orbits into a single mosaic, as is the usual way to display planetary data, iMars keeps and simultaneously displays datasets from different orbits separately in order to capture snapshots of the surface at specific moments in time (thus making it easier to identify any changes).
"Using the system makes the daily work of planetary scientists easier, and the outcomes more robust," says Walter. "All iMars data are pre-processed, which saves a lot of time that would otherwise be needed to find, download, process and visualise a dataset manually. It also includes unique capabilities for visualisation–it's possible, for example, to "play" the different images in time like a movie–but even if only used for locating features or images from the different available datasets and comparing them through time, it's a great little helper tool."
The iMars team has put together a video tutorial on how to use the system, available here.
Future development: New data, new features, new planets
The further development of both iMars and PSUP is ongoing. For example, the iMars webGIS features new Mars Express HRSC topographic data for the area surrounding the residual South Polar Cap, and the team is currently working on applying the same approach to the North Polar Cap.
"We also plan to add all available HRSC images, and the tool will eventually allow users to download the data," says Walter. "As more data are processed in the future, I hope that a great deal more of Mars will become completely covered on the system. For example, currently, only the MC11 quadrangle is completely available–this will improve in time."
Mars' surface is split into 30 quadrangles for easy identification by the United States Geological Survey (USGS); the MC11 quadrangle, otherwise known as the Oxia Palus quadrangle, contains Oxia Planum and Mawrth Vallis, both of which are candidate landing sites for ExoMars 2020, and the landing site for NASA's Mars Pathfinder mission in 1997.
Future development is also planned for PSUP. "Alongside adding new datasets, mineral abundance maps, and global image mosaics, we hope that we can use PSUP to create products for the public as well as for the science community; for example, at IAS we've started to develop a tool that'll allow a 3D virtual tour of any set–or 'cube', as it's known–of OMEGA observations available via PSUP," adds Poulet.
"We also plan to further improve our facility to include radar data for Mars," adds Quantin-Nataf, "and hope to extend the application to other planetary bodies: the Moon, Titan, and others!"
As well as enabling scientists at all levels and across all disciplines to comprehensively explore and analyse the Martian surface, access and share data, and locate high-quality processed data swiftly and easily, tools such as iMars webGIS and PSUP have a direct impact on ongoing mission plans.
"Such systems and portals can be used to help us identify potential landing sites for our missions to Mars," says Dmitri Titov, ESA Project Scientist for Mars Express. "Selecting a landing site is crucial to mission success, and in order to choose the right one, we need to know exactly what we might hope to find in a given location, and why it may be better than another one."
"The Mars Express mission has sent back a wealth of high-quality data from Mars, and it is still going strong," he adds. "Making it possible to access, process, compare, and understand large amounts of this data is exactly what we need for our appraisals of future landing sites–and exactly what tools such as iMars webGIS and PSUP will help us to do."
Notes for editors
The iMars webGIS can be accessed here or here.
Details about iMars webGIS can be found in "The Web‐Based Interactive Mars Analysis and Research System for HRSC and the iMars Project" by S.H.G. Walter et al., Earth and Space Science, 2018; doi: 10.1029/2018EA000389.
(This publication supersedes the earlier reference "The iMars WebGIS – Space-Time Queries and Dynamic Time Series of Single Images" by S.H.G. Walter et al., Lunar and Planetary Science XLVIII (2017), http://www.lpi.usra.edu/meetings/lpsc2017/pdf/1066.pdf)
The Planetary SUrface Portal (PSUP) can be accessed here.
Details about PSUP can be found in "PSUP: A Planetary SUrface Portal" by F. Poulet et al., Planetary and Space Science, 2017; doi: 10.1016/j.pss.2017.01.016.
ESA's Mars Express mission launched in 2003, arrived at Mars later that year, and has been sending back high-quality data since. More information about the mission can be found here.
For further information, please contact:
François Poulet
CNRS/Université Paris-Sud
Paris, France
Tel: +(33) 1 69 85 85 82
Email: francois.poulet![]() ias.u-psud.fr
ias.u-psud.fr
Cathy Quantin-Nataf
University of Lyon
Lyon, France
Tel: +33 (0)4 72 43 13 55
Email: cathy.quantin-nataf![]() univ-lyon1.fr
univ-lyon1.fr
Sebastian Walter
Freie Universitaet Berlin
Berlin, Germany
Tel: +49 30 838 70541
Email: sebastian.walter![]() fu-berlin.de
fu-berlin.de
Dmitri Titov
ESA Mars Express project scientist
Directorate of Science
European Space Agency
Email: dmitri.titov![]() esa.int
esa.int


