Spectral signatures of carbon dioxide and ozone at Mars

Date: 27 July 2020
Satellite: Trace Gas Orbiter
Copyright: K. Olsen et al. (2020)
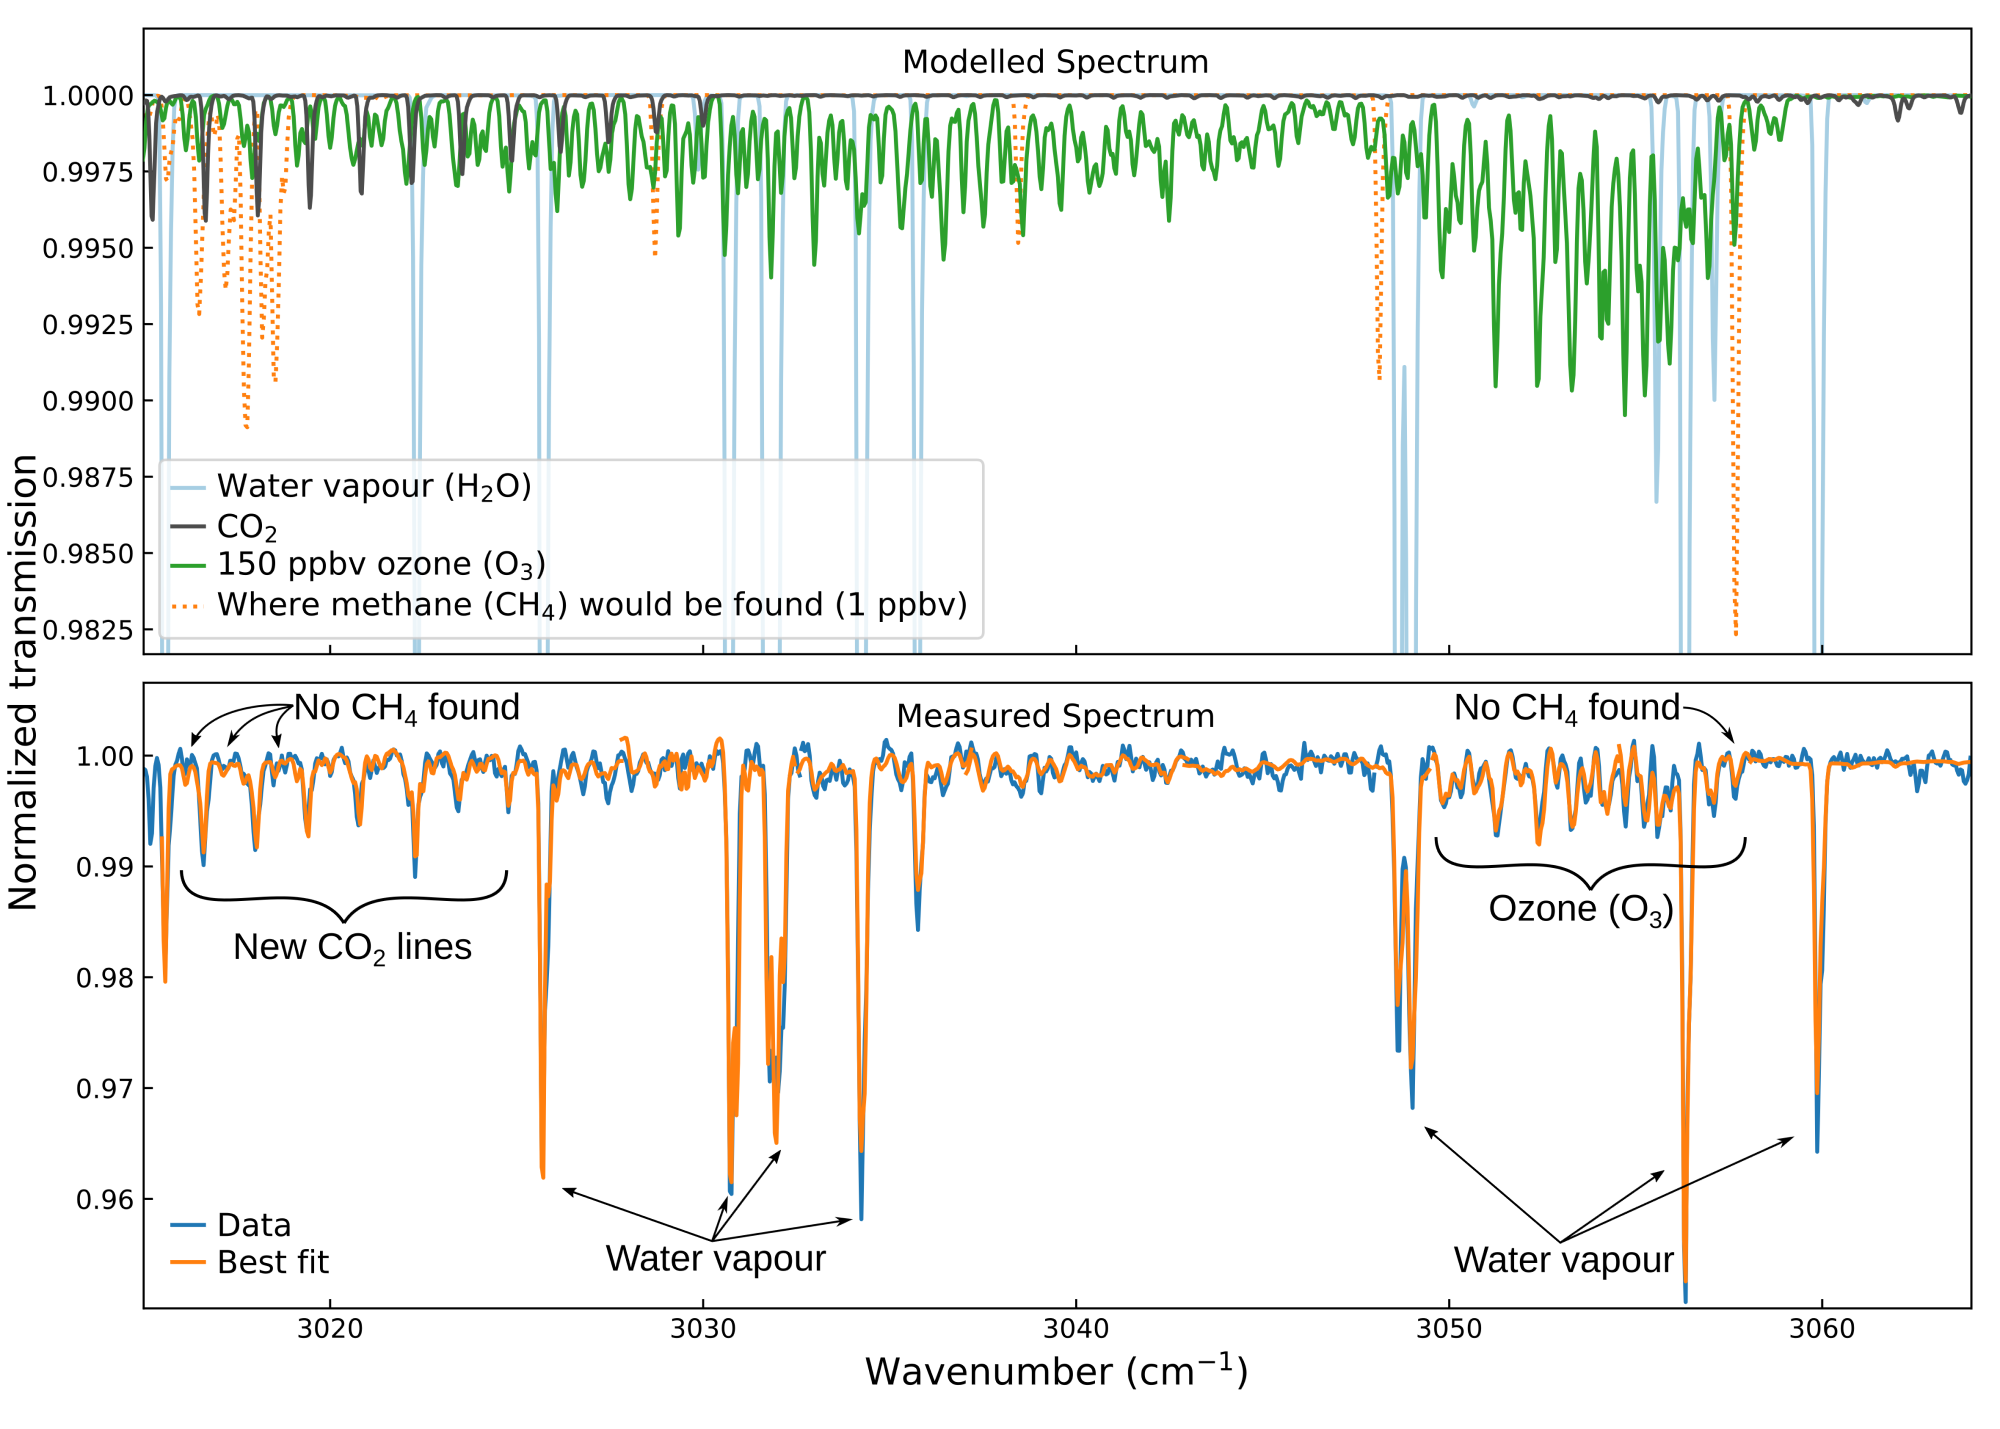
This graph shows an example of the measurements made by the Atmospheric Chemistry Suite (ACS) MIR instrument on ESA's ExoMars Trace Gas Orbiter (TGO), featuring the spectral signatures of carbon dioxide (CO2) and ozone (O3).
The bottom panel shows the data (blue) and a best-fit model (orange).
The top panel shows the modelled contributions from a variety of different gases for this spectral range. The deepest lines come from water vapour (light blue). The strongest O3 feature (green) is on the right, and distinct CO2 lines (grey) appear on the left. The locations of strong methane features (orange) are also shown in the modelled contributions, though methane is not observed in the TGO data.
More information: ExoMars finds new gas signatures in the martian atmosphere